Matrix identification
Matrix identification (MID) refers to a lithology solution in petrophysics where the bulk density and photoelectric factor are used to estimate the lithologies of the rocks being logged.
When a standard triple combo log is run in a well, the tool is utterly naive to the true identity of the rocks it encounters. The bulk density for example really measures electron density, and the neutron log (grossly simplified) measures hydrogen, and neither has any clue about what lithology it is looking at.
Instead it says, “this soup of solids and fluids has these electrochemical and nuclear properties.” It doesn’t say which specific combination of minerals and fluids are present, and indeed any number of combinations would result in the same raw readings. It is up to the petrophysicist to interpret the readings.
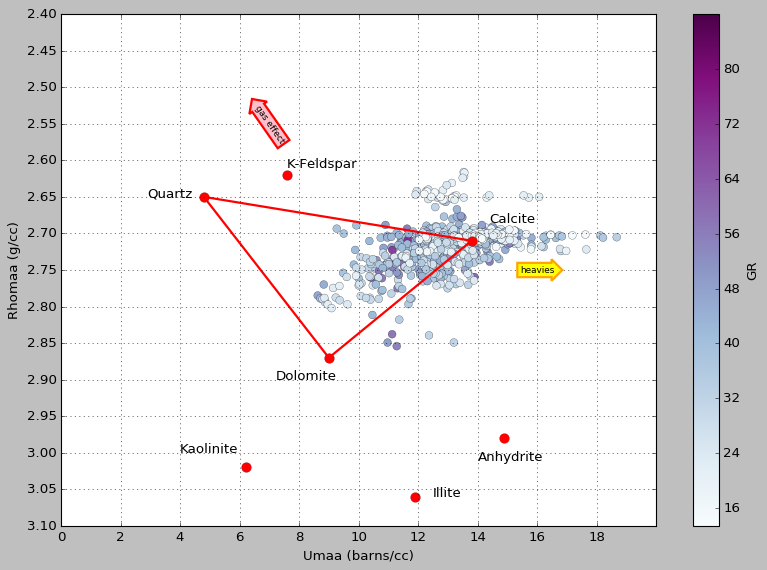
MID is one way to guess at a simple lithology. The basic idea is this: take bulk density and subtract porosity to get the apparent matrix density (ρmaa), and take the photoelectric factor and manipulate it to get the (porosity-free) apparent volumetric photoelectric cross-section (Umaa). Then you cross-plot those two parameters and see where the points plot on a ternary diagram, defined by ideal mineral endmembers (plotted as red dots and labeled):
Matrix math
How do we go from a ternary plot like the one above to a quantitative estimate of lithology? One way is to use matrix math to identify the, ahem, matrix. In other words, we use linear algebra to estimate mineral volumes.
After we’ve subtracted out porosity to get ρmaa and Umaa, we can solve for three minerals. But I first should introduce the unity equation. It’s an assumption we have to make to get the math to work. All the unity equation says is that the volumes of these three minerals sum to make up the entirety of the rock matrix. Traditionally the three minerals identified with MID are dolomite, calcite, and quartz, so I’ll use those in this example.
1 = Vdol + Vcal + Vqtz
With that assumption, we can then say that the values we have from logs for ρmaa and Umaa are a mix of the ρmaa and Umaa values of each mineral, proportional to their respective volumes. That’s a mouthful– maybe the equations make it clearer:
ρmaa = (ρdol ∙ Vdol) + (ρcal ∙ Vcal) + (ρqtz ∙ Vqtz)

Umaa = (Udol ∙ Vdol) + (Ucal ∙ Vcal) + (Uqtz ∙ Vqtz)
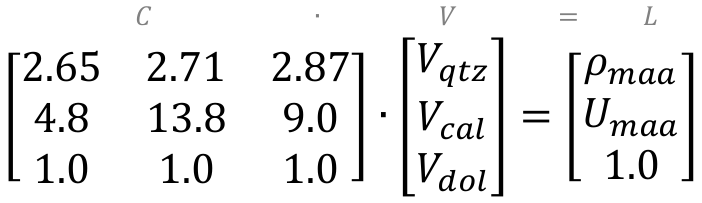
We know the ρ and U of each of these components from chartbooks (reference books provided by logging vendors), so just three unknowns remain: the volumes of dolomite, calcite, and quartz. These three equations (to go with the three unknowns) can be reframed as a linear algebra expression:
C ∙ V = L
where L is a vector of the log responses (measured by logging tools), C is a matrix of component petrophysical properties (i.e. ρmaa and Umaa from chartbooks), V is a vector of proportions of each component (unknown). Densities of quartz, calcite, and dolomite respectively are 2.65, 2.71, and 2.87 g/cc, and the U values are 4.8, 13.8, and 9.0 b/e respectively, so here’s what it looks like when we plug in those values:
To solve for the vector V, we rearrange the equation by multiplying both sides of the equation by the inverse of C (that is, C-1) to get:
V = C-1 ∙ L
When we invert C and do the algebra, the equation looks like this:
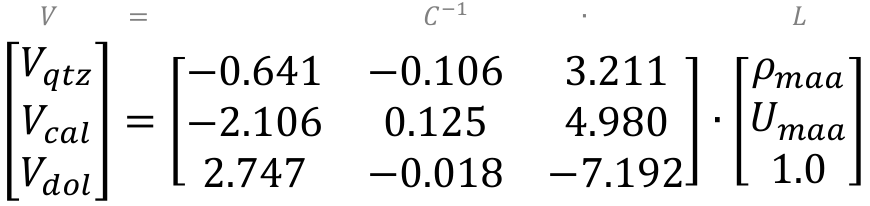
This expression can be rewritten as discrete equations to get the volumes for each mineral component:
Vqtz = −0.641 ∙ ρmaa − 2.106 ∙ Umaa + 2.747

Vcal = −0.106 ∙ ρmaa + 0.125 ∙ Umaa - 0.018

Vdol = 3.211 ∙ ρmaa + 4.980 ∙ Umaa - 7.192
In some cases this may result in negative volumes or volumes greater than 100% (when points fall outside the ternary plot). So what I typically do is clip results to 0 and 1 and re-standardize to 100%.
That is the basic methodology. For a more in-depth treatment of the topic, don’t miss John Doveton’s Geologic Log Analysis Using Computer Methods (1994). In a future post, I’ll use some real well log data and make some plots using python, so check back!